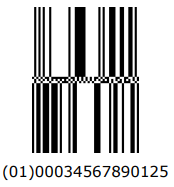
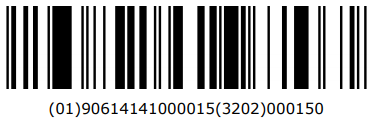
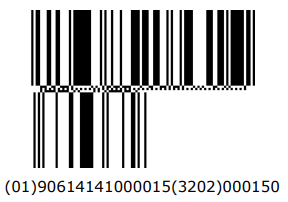
The GS1 DataBar is a family of barcodes used for a variety of applications, particularly in the retail and healthcare industries. Within this family, there are three types of GS1 DataBar symbols and seven DataBar variations. Dynamsoft Barcode Reader can read all the variations.
Here's a comparison table that outlines the key characteristics of the different variations of the GS1 DataBar family:
| Barcode Variation |
Capacity |
Size (Width x Height) |
Intended for Use at Point-of-Sale |
Designed Usage Scenario |
| GS1 DataBar Omnidirectional |
GTIN-14 |
96X x 33X |
Yes |
General retail products, can be scanned omnidirectionally |
| GS1 DataBar Truncated |
GTIN-14 |
96X x 13X |
No |
Small items, not intended for omnidirectional scanning |
| GS1 DataBar Stacked |
GTIN-14 |
50X x 13X (per row) |
No |
Small items, stacked format for limited space, not for omnidirectional scanning |
| GS1 DataBar Stacked Omnidirectional |
GTIN-14 |
50X x 69X (per row) |
Yes |
Small items, stacked format, can be scanned omnidirectionally |
| GS1 DataBar Limited |
GTIN-12 (UPC-A) or GTIN-13 (EAN-13) |
79X x 10X |
No |
Very small items, not for omnidirectional scanning |
| GS1 DataBar Expanded |
Variable (up to 74 numeric or 41 alphanumeric characters) |
Min 102X x 34X, Max 534X x 34X |
Yes |
Variable weight products, coupons, and items requiring additional information |
| GS1 DataBar Expanded Stacked |
Variable (up to 74 numeric or 41 alphanumeric characters) |
Variable width x (34X + 3X separator pattern) per row |
No |
Products requiring additional information, stacked format for limited space |
The First Group of GS1 DataBar Symbols
The first type has four variations:
GS1 DataBar Omnidirectional
The GS1 DataBar Omnidirectional dimensions are 96X wide, starting with a 1X space and ending with a 1X bar, by 33X high (where X is the width of a module). 33X is the minimum height of the symbol but the actual height of the symbol used depends on the specific application requirements.

GS1 DataBar Truncated
The GS1 DataBar Truncated barcode is a reduced height variation of the GS1 DataBar Omnidirectional barcode that is designed for small items that will not need to be read by omnidirectional scanners. Its dimensions are 96X wide by 13X high (where X is the width of a module).

GS1 DataBar Stacked
The GS1 DataBar Stacked barcode is a reduced height two-row variation of the GS1 DataBar Omnidirectional barcode that is designed for small items that will not need to be read by omnidirectional scanners. Its dimensions are 50X wide by 13X high (where X is the width of a module).

GS1 DataBar Stacked Omnidirectional
The GS1 DataBar Stacked Omnidirectional barcode is a full height, two-row variation of the GS1 DataBar Omnidirectional barcode that is designed to be read by an omnidirectional scanner, such as a retail slot scanner. Its dimensions are 50X wide by 69X high (where X is the width of a module). 69X is the minimum height of the symbol but the actual height of the symbol used depends on the specific application requirements.

The Second Group of GS1 DataBar Symbols — GS1 DataBar Limited
The second group of of GS1 DataBar Symbol comprises only one variation. It’s ideal for use on small items that will not be scanned in an omnidirectional scanning environment.
GS1 DataBar Limited
The GS1 DataBar Limited barcode is designed for small items that will not need to be read by omnidirectional point-of-sale (POS) scanners. Its dimensions are 79X wide, starting with a 1X space and ending with a 5X space, by 10X high (where X is the width of a module).

The Third Group of GS1 DataBar Symbols — GS1 DataBar Expanded Variations
The third type has two variations:
- GS1 DataBar Expanded (a single row variation)
- GS1 DataBar Expanded Stacked (a multi-row stacked variation)
GS1 DataBar Expanded (a single row variation)
The GS1 DataBar Expanded barcode has a variable width (from 4 to 22 symbol characters, or a minimum of 102X wide and a maximum of 534X wide) and is 34X high (where X is the width of a module). The symbol starts with a 1X space and ends with either a 1X bar or space.

contentGS1 DataBar Expanded Stacked (a multi-row stacked variation)
The GS1 DataBar Expanded Stacked barcode is a multi-row stacked variation of GS1 DataBar Expanded. It can be printed in widths of 2 to 20 segments and can have from 2 to 11 rows. Its structure includes a 3X high separator pattern between rows.
GS1 DataBar Expanded Stacked is used when the symbol area or print mechanism is not wide enough to accommodate the full single-row GS1 DataBar Expanded symbol. It is designed for variable weight products, perishable products, traceable retail products, and coupons.

How could Dynamsoft help you with GS1 DataBar Omnidirectional?
Dynamsoft barcode reader enables you to efficiently embed high-speed and reliable barcode reading functionality in your web, desktop or mobile application using just a few lines of code.
Download the free trial SDK, explore our helpful resource center including sample codes, tutorials, guides and more to get started.