What is a Micro PDF417?
Based on the PDF417 barcode, the Micro PDF417 is a variable-length stacked 2D barcode symbology. It can encode a moderate amount of data in a tiny space.
A common Micro PDF417 barcode looks like this:

Difference Between Micro PDF417 and PDF417
Micro PDF417 barcode does not contain start/stop characters like the conventional PDF417 symbol. Hence, it is a more efficient representation of the PDF417 barcode.
Unlike, PDF417 codes, Micro PDF417 barcodes may only be printed in specifically defined combinations of columns, rows, and error correction codewords, to four data columns by 44 rows at the most.
Industry
- Logistics
- Warehousing
- Government
How could Dynamsoft help you with Micro PDF417?
Dynamsoft barcode reader enables you to efficiently embed high-speed and reliable barcode reading functionality in your web, desktop or mobile application using just a few lines of code.
Download the free trial SDK, explore our helpful resource center including sample codes, tutorials, guides and more to get started.
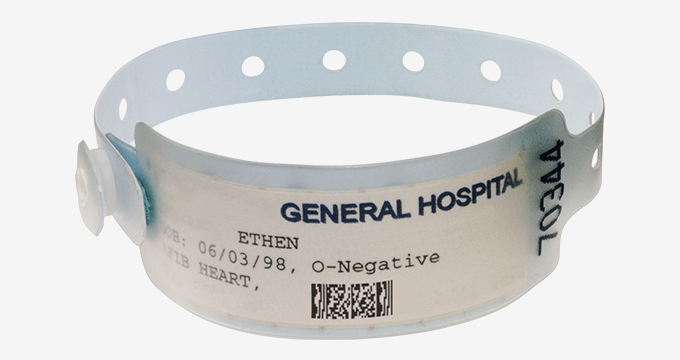
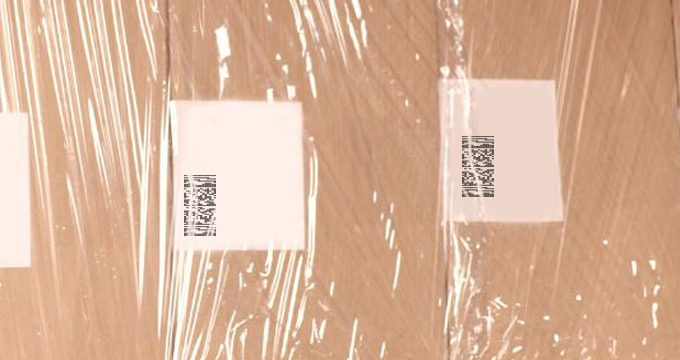
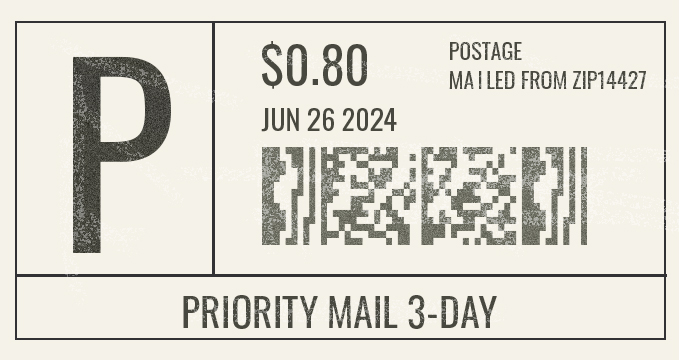
Effortlessly scan challenging Micro PDF417 codes like below with the Dynamsoft Barcode Reader.
Tiny Size |
Inadequate Lighting |
Damaged |
Poor Printing Quality |
|
|

|
|
Micro PDF417 barcodes are designed to be small, but if they are reduced too much, the barcode elements may become too tiny for the scanner to read. |
Poor lighting or excessive glare can interfere with the scanner's ability to capture the barcode image accurately. |
Micro PDF417 barcodes do not contain start/stop characters like the conventional PDF417 symbol. So it's more vulnerable to physical damage such as scratches, tears which can distort the barcode's pattern, making it unreadable. |
If the barcode is printed with low resolution, smudging, low contrast colors or inconsistent ink density, it can make the tiny elements of the Micro PDF417 barcode difficult to distinguish. |