What is a DotCode?
A DotCode is a 2D barcode symbology composed of disconnected dots.

In the DotCode Revision 4.0 released in July 2019, AIM defines DotCode as follows:
"DotCode is a public domain optical data carrier designed to be reliably readable when printed by high-speed inkjet or laser dot technologies. With this standard, real-time data like expiration date, lot number, or serial number can be applied to products in a machine-readable form at production line speeds."
Specifications and Imaging Geometry
The DotCode was created so it could be printed by high-speed technologies. An example of its use is in consumer beverage bottling factories where more than 1,000 bottles are processed per minute.
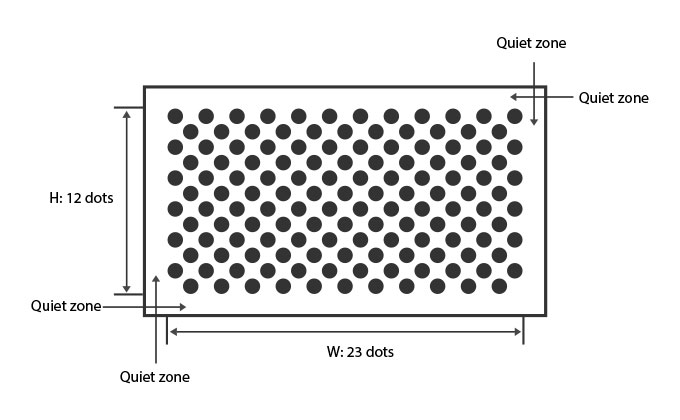
"DotCode symbols consist of a rectangular array of dots that are each positioned on a grid diagonal to that rectangle, like the dark squares on a checkerboard. These alternating dot positions are called "data dot" locations and are the only locations made available for data encoding (printing or marking). These data dot locations comprise exactly half the dot positions that could normally be printed in such an area. Data dot locations enable all the printed dots to stay nominally disconnected, providing internal clocking information that is valuable for decoding and for ease of printing using high-speed drop-on-demand and continuous inkjet, as well as laser marking technologies."

Character Set and Capacity
DotCode barcode can encode the following data:
- GS1 data structures (application identifiers + data) as stated in GS1 General Specification.
- All 128 ASCII characters, i.e., ASCII characters 0 to 127 inclusively, in accordance with ISO 646.
- Extended ASCII characters (128 to 255) and pure binary sequences.
There is no fundamental maximum capacity.
Error Detection and Correction
Uses the Reed-Solomon algorithm for error correction.
Structure
-
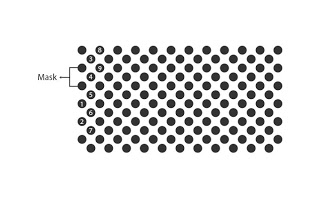
Uses a nine-dot pattern to represent a codeword. A printed dot represents one and an unprinted dot represents 0. For example, the codeword for character “A” is 33 and the dot pattern is 010010111.

- The shape of printed dots can be circles or squares.
- A DotCode is rectangular and sizing is flexible. The sum of H (rows) and W (columns) must be odd. When H is odd and then W should be even, and vice versa. DotCode symbols with a value of either H or W that is a multiple of 9 are inherently the most robust.
-
A quiet zone of three-dot spacings is required on all four sides of the symbol.

- Finder pattern
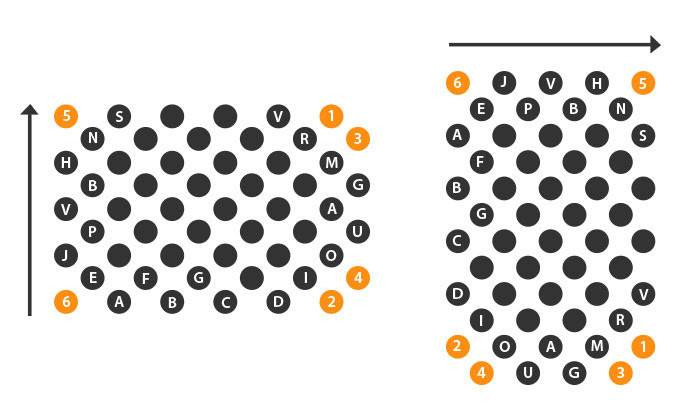
The edge containing two corner data dots determines the bitstream origin and direction. For a symbol with the two data dots along the W, the bitstream flows top to down. For a symbol with the two data dots along the H, the bitstream flows left to right.
How Dynamsoft Barcode Reader Decodes a DotCode Barcode
Localization
1. Input a binary image and find a set contours_A containing circular-shaped or square-shaped contours.
2. Split contours_A into several subsets (contours_A1, contours_A2, … contours_An, which may represent different DotCode symbols) in accordance with different contour sizes.
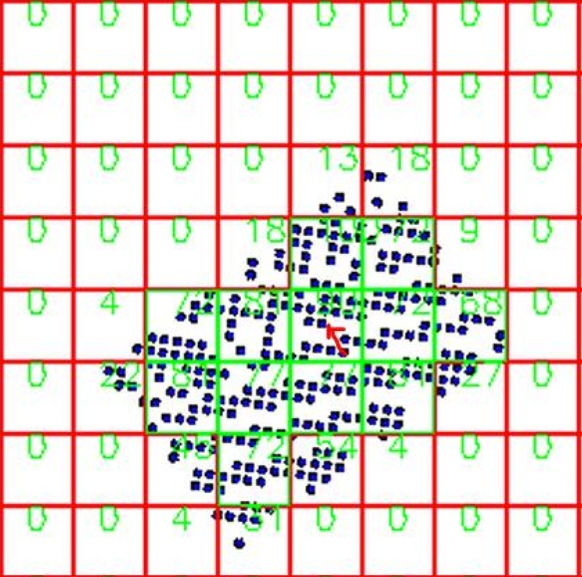
3. For every subset, based on the spatial index, find the indexed block spatialBlock_Cn with the most contours.
4. Starting from spatialBlock_Cn, search adjacent blocks for contours to form an area.
5. Calculate the angle between every two dots. According to the angular distribution, if there are two peaks and the difference is 90 degrees, we can conclude that the symbol is DotCode.

Decoding
1. Use the average module size to refine the DotCode barcode region.
2. Get the rows and columns of the DotCode symbol.
3. Map the DotCode symbol region to a (0, 1) matrix.
4. Decode the DotCode barcode according to the standard decoding rules.
Code Snippet
Configure the parameter as follows: runtimeSettings->barcodeFormatIds_2 = BF2_DOTCODE;
Industry
DotCode presents tremendous opportunities in the beverage, distribution, and ecommerce markets.
How could Dynamsoft help you with DotCode?
Dynamsoft barcode reader enables you to efficiently embed high-speed and reliable barcode reading functionality in your web, desktop or mobile application using just a few lines of code.
Download the free trial SDK, explore our helpful resource center including sample codes, tutorials, guides and more to get started.
Effortlessly scan challenging DotCodes with the Dynamsoft Barcode Reader.
Batch Scanning Limitations |
Printing Issues |
Susceptibility to Damage |
Challenges with Curved and Glossy Surfaces |

|

|

|

|
DotCode is often used in industries like beverages, where thousands of barcodes are scanned simultaneously Many common barcode scanners lack the capability to efficiently batch scan DotCodes at this high volume. |
High-speed printing technologies, such as laser jet or inkjet printers, are commonly used for DotCode. However, these high-speed processes can result in printing inaccuracies, such as misaligned or incomplete dots, which lead to scanning failures and misreads. |
Unlike 1D barcodes, DotCodes, as a 2D barcode symbology, are more susceptible to physical damage. Scratches, smudges, or even partial removal of the code can make it harder for barcode scanners to accurately decode the information. |
DotCode is frequently used in industries such as tobacco, where products are often packaged in curved or glossy materials. These surfaces present additional challenges for scanners to read the code accurately. |