The POSTNET (Postal Numeric Encoding Technique) barcode symbology was used by the USPS for directing mail of items. It was commonly placed above a printed address on a mail item. Such a mail item could be a standard envelope, flat or similar item.
The ZIP Code or ZIP+4 code was encoded in half- and full-height bars. Usually, a delivery point was added, and this was often the last two digits of the address or PO box number. This barcode started and ended with a full bar. It had a check digit after the ZIP, ZIP+4, or delivery point.
Each individual digit was represented by a set of five bars, two of which are full bars. The full bars represented bits that were on. There were four formats of POSTNET barcodes.
- This included a five-digit barcode that contained only a basic ZIP Code and was 32 bars.
- Then there was a six-digit barcode that contained the last 2 digits of a ZIP Code.
- There was also a nine-digit barcode that contained the ZIP Code and ZIP+4 Code and it was 52 bars total. This barcode was primarily for sorting mail to an individual delivery carrier.
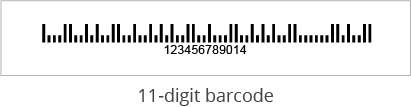
- An 11-digit barcode was used that contained the ZIP Code, ZIP+4 Code, and the delivery point code and it was 62 bars total.
All these barcodes also had a check digit. The use of a delivery point code was so the USPS could sort mail into delivery point (address) sequences.
Ultimately, the POSTNET 11-digit barcode became the standard for the USPS until the Intelligent Mail barcode was developed. Eventually, the POSTNET barcode gave way to the Intelligent Mail barcode in the 2009. Essentially, the Intelligent Mail barcode combined all previous POSTNETs and markings into this single barcode.
The Intelligent Mail barcode was initially going to be required starting in 2011 to get automation mail discounts. But the USPS changed this and allowed POSTNET use to continue until 2013. It was finally at this point that the Intelligent Mail barcode became required for reduced rates.
How could Dynamsoft help you with Postnet?
Dynamsoft barcode reader enables you to efficiently embed high-speed and reliable barcode reading functionality in your web, desktop or mobile application using just a few lines of code.
Download the free trial SDK, explore our helpful resource center including sample codes, tutorials, guides and more to get started.