Maximum sustained wind
| Category | m/s | knots | mph | km/h |
|---|---|---|---|---|
| 5 | ≥ 70 | ≥ 137 | ≥ 157 | ≥ 252 |
| 4 | 58–70 | 113–136 | 130–156 | 209–251 |
| 3 | 50–58 | 96–112 | 111–129 | 178–208 |
| 2 | 43–49 | 83–95 | 96–110 | 154–177 |
| 1 | 33–42 | 64–82 | 74–95 | 119–153 |
| TS | 18–32 | 34–63 | 39–73 | 63–118 |
| TD | ≤ 17 | ≤ 33 | ≤ 38 | ≤ 62 |
The maximum sustained wind associated with a tropical cyclone is a common indicator of the intensity of the storm. Within a mature tropical cyclone, it is found within the eyewall at a distance defined as the radius of maximum wind, or RMW. Unlike gusts, the value of these winds are determined via their sampling and averaging the sampled results over a period of time. Wind measuring has been standardized globally to reflect the winds at 10 metres (33 ft) above mean sea level,[nb 1] and the maximum sustained wind represents the highest average wind over either a one-minute (US) or ten-minute time span (see the definition, below), anywhere within the tropical cyclone. Surface winds are highly variable due to friction between the atmosphere and the Earth's surface, as well as near hills and mountains over land.
Over the ocean, satellite imagery determines the value of the maximum sustained winds within a tropical cyclone. Land, ship, aircraft reconnaissance observations, and radar imagery can also estimate this quantity, when available. This value helps determine damage expected from a tropical cyclone, through use of such scales as the Saffir–Simpson scale.
Definition[edit]
The maximum sustained wind normally occurs at a distance from the center known as the radius of maximum wind, within a mature tropical cyclone's eyewall, before winds decrease at farther distances away from a tropical cyclone's center.[2] Most weather agencies use the definition for sustained winds recommended by the World Meteorological Organization (WMO), which specifies measuring winds at a height of 10 metres (33 ft) for 10 minutes, and then taking the average. However, the United States National Weather Service defines sustained winds within tropical cyclones by averaging winds over a period of one minute, measured at the same 10 metres (33 ft) height.[3] This is an important distinction, as the value of the highest one-minute sustained wind is about 14% greater than a ten-minute sustained wind over the same period.[4]
Determination of value[edit]
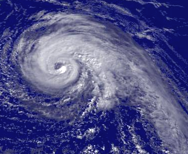
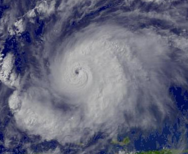
In most tropical cyclone basins, use of the satellite-based Dvorak technique is the primary method used to determine a tropical cyclone's maximum sustained winds.[5] The extent of spiral banding and difference in temperature between the eye and eyewall is used within the technique to assign a maximum sustained wind and pressure.[6] Central pressure values for their centers of low pressure are approximate. The intensity of example hurricanes is derived from both the time of landfall and the maximum intensity.[7] The tracking of individual clouds on minutely satellite imagery could be used in the future in estimating surface winds speeds for tropical cyclones.[8]
Ship and land observations are also used, when available. In the Atlantic as well as the Central and Eastern Pacific basins, reconnaissance aircraft are still utilized to fly through tropical cyclones to determine flight level winds, which can then be adjusted to provide a fairly reliable estimate of maximum sustained winds. A reduction of 10 percent of the winds sampled at flight level is used to estimate the maximum sustained winds near the surface, which has been determined during the past decade through the use of GPS dropwindsondes.[9] Doppler weather radar can be used in the same manner to determine surface winds with tropical cyclones near land.[10]

|

|

|

|
| Tropical Storm Wilma at T3.0 | Tropical Storm Dennis at T4.0 | Hurricane Jeanne at T5.0 | Hurricane Emily at T6.0 |
Variation[edit]
Friction between the atmosphere and the Earth's surface causes a 20% reduction in the wind at the surface of the Earth.[11] Surface roughness also leads to significant variation of wind speeds. Over land, winds maximize at hill or mountain crests, while sheltering leads to lower wind speeds in valleys and lee slopes.[12] Compared to over water, maximum sustained winds over land average 8% lower.[13] More especially, over a city or rough terrain, the wind gradient effect could cause a reduction of 40% to 50% of the geostrophic wind speed aloft; while over open water or ice, the reduction is between 10% and 30%.[9][14][15]
Relationship to tropical cyclone strength scales[edit]
In most basins, maximum sustained winds are used to define their category. In the Atlantic and northeast Pacific oceans, the Saffir–Simpson scale is used. This scale can be used to determine possible storm surge and damage impact on land. In most basins, the category of the tropical cyclone (for example, tropical depression, tropical storm, hurricane/typhoon, super typhoon, depression, deep depression, intense tropical cyclone) is determined from the cyclone's maximum sustained wind over one minute. Only in Australia is this quantity not used to define the tropical cyclone's category; in that basin, maximum sustained wind speed is measured over 10 minutes.
Notes[edit]
References[edit]
- ^ Simiu, Emil; Vickery, Peter; Kareem, Ahsan (July 2007). "Relation Between Saffir-Simpson Hurricane Scale Wind Speeds and Peak 3-s Gust Speeds Over Open Terrain". Journal of Structural Engineering. Technical Notes. 133 (7). Reston, Virginia: 1043. doi:10.1061/(ASCE)0733-9445(2007)133:7(1043).
- ^ Brian W. Blanchard and S. A. Hsu. ON THE RADIAL VARIATION OF THE TANGENTIAL WIND SPEED OUTSIDE THE RADIUS OF MAXIMUM WIND DURING HURRICANE WILMA (2005). Archived 2012-09-05 at the Wayback Machine Retrieved on 2008-07-04.
- ^ Tropical Cyclone Weather Services Program (June 1, 2006). "Tropical cyclone definitions" (PDF). National Weather Service. Retrieved 2006-11-30.
- ^ United States Navy: "SECTION 2. INTENSITY OBSERVATION AND FORECAST ERRORS". Archived from the original on 2007-09-16. Retrieved 2008-07-04.
{{cite web}}: CS1 maint: bot: original URL status unknown (link) Retrieved on 2018-10-07. - ^ "Objective Dvorak Technique". University of Wisconsin–Madison. Retrieved 2006-05-29.
- ^ Chris Landsea (June 8, 2010). Subject: H1) What is the Dvorak technique and how is it used? Atlantic Oceanographic and Meteorological Laboratory. Retrieved on 2011-01-14.
- ^ National Hurricane Center (June 22, 2006). "Saffir-Simpson Hurricane Scale Information". National Oceanic and Atmospheric Administration. Retrieved 2007-02-25.
- ^ A. F. Hasler, K. Palaniappan, C. Kambhammetu, P. Black, E. Uhlhorn, and D. Chesters. High-Resolution Wind Fields within the Inner Core and Eye of a Mature Tropical Cyclone from GOES 1-min Images. Retrieved on 2008-07-04.
- ^ a b Franklin, James L., Michael L. Black, and Krystal Valde. GPS dropwindsonde wind profiles in hurricanes and their operational implications. Retrieved on 2008-07-04.
- ^ J. TUTTLE and R. GALL. A single-radar technique for estimating the winds in tropical cyclones. Retrieved on 2008-06-12.
- ^ Haby, Jeff. "The Importance of Friction". theweatherprediction.com.
- ^ Mapping of Topographic Effects on Maximum Sustained Surface Wind Speeds in Landfalling Hurricanes. Retrieved on 2008-07-04.
- ^ Peter Black. Subject: Re: Offshore vs nearshore sonde composite. Retrieved on 2008-07-04.
- ^ Harrison, Roy (1999). Understanding Our Environment. Cambridge: Royal Society of Chemistry. pp. 11. ISBN 0-85404-584-8.
- ^ Thompson, Russell (1998). Atmospheric Processes and Systems. New York: Routledge. pp. 102–103. ISBN 0-415-17145-8.
