Reading Damaged Barcodes
Improving accuracy and decoding rate remains a top priority for developers working with barcode reading SDKs. While configuration tweaks and improvements in the algorithm can result in drastic improvements, end users can also play a significant role by improving the image resolution at the time the image is taken, ensuring an adequate quiet zone, and avoiding other defects. For more information, read this post on how to improve barcode recognition accuracy when using an application.
This article is Part 1 in a 5-Part Series.
- Part 1 - Reading Damaged Barcodes
- Part 2 - QR Codes Recognition: High-Density
- Part 3 - Scan Direct Part Marking (DPM) Codes
- Part 4 - Auto-Restores Incomplete QR Codes and Data Matrix
- Part 5 - Optimizes Decoding for Crumpled QR Codes
In this post, we are going to talk about reading damaged barcodes.
How to Read Damaged 1D Barcodes
Barcodes represented data by varying the widths and spacings of parallel lines.

If the lines are partly ripped or scribbled, as long as there is a valid part, we can still read them.


If the lines are severely damaged, but the human-readable text is still there. We can use OCR to read them. The Dynamsoft Label Recognizer is a good fit for this situation.

How to Read Damaged QR Codes
2D barcodes, such as QR codes, are an evolution of 1D barcodes and are designed to be damage-resistant.
QR codes use Reed–Solomon error correction, allowing them to be read even if damaged. When generating QR codes, users can choose from four error correction levels: Low, Medium, High, and Quartile. The highest correction level can restore up to 30% of data bytes.

Dynamsoft Barcode Reader can utilize QR code error correction to read damaged QR codes. The code below is readable because the damaged area is less than 30%.

However, some QR codes are unreadable by certain barcode scanners, such as the one below, because its finder pattern is broken.

Dynamsoft Barcode Reader can make extra efforts to read damaged QR codes, even restoring those with broken finder patterns like the one above. Learn more in this post: DBR Auto-Restores Incomplete Parts of QR Codes and Data Matrix.
How to Read Damaged PDF417 Codes
PDF417 is a versatile 2D barcode format used widely in various applications, including identification cards, inventory management, and transportation. This barcode type is designed to withstand damage and still remain readable.
PDF417 utilizes error correction techniques to ensure data integrity, with levels ranging from 0 to 8. Higher levels offer greater redundancy, enhancing the ability to decode damaged barcodes.
Dynamsoft Barcode Reader leverages these error correction features to read damaged PDF417 codes. The example below demonstrates a code that remains readable because the damage is within the error correction limits.

However, some PDF417 codes become unreadable when damage is too extensive or affects critical areas of the code, making them difficult for standard barcode scanners to interpret. Dynamsoft Barcode Reader employs advanced techniques to handle even significantly damaged PDF417 codes. This ensures that data can be recovered from barcodes that might otherwise be considered unreadable.

How to Read Damaged Data Matrix Codes
Data Matrix is a compact 2D barcode format commonly used for labeling small items, such as electronic components and medical devices. Its design ensures that it remains readable even when partially damaged. Data Matrix codes utilize Reed-Solomon error correction to maintain data integrity. The example below shows a code that remains readable despite partial damage.

In some cases, Data Matrix codes may become unreadable if the damage is too extensive or if the finder patterns of the code are missing. Dynamsoft Barcode Reader employs advanced algorithms to achieve high reliability even in challenging conditions.

Licensing
These capabilities are integrated into all editions of Dynamsoft Barcode Reader and require no extra licenses. Supported editions include Windows, Linux, iOS, Android, and JavaScript.
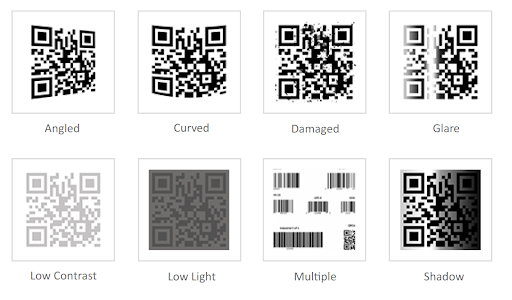
How Dynamsoft Barcode Reader Scans Difficult-to-Read Barcodes?
Dynamsoft Barcode Reader can also read the following types of difficult-to-read barcodes:
- Angled
- Curved
- Glare
- Low contrast
- Low light
- Multiple
- Shadow

Use our online demo to have a try on your own: https://demo.dynamsoft.com/barcode-reader/.
Getting Started
If you have a barcode that you aren’t able to decode, send it to support@dynamsoft.com and we will recommend possible parameters you can use to solve the decoding issues.
Learn more about Dynamsoft Barcode Reader SDK and start a free 30-day trial.
For questions about Dynamsoft’s SDKs, please contact our support team.
Download Barcode Testing Sheet and Test Dynamsoft Barcode Reader on Damaged Barcodes


 Blog
Blog
