Tag: web-twain
-
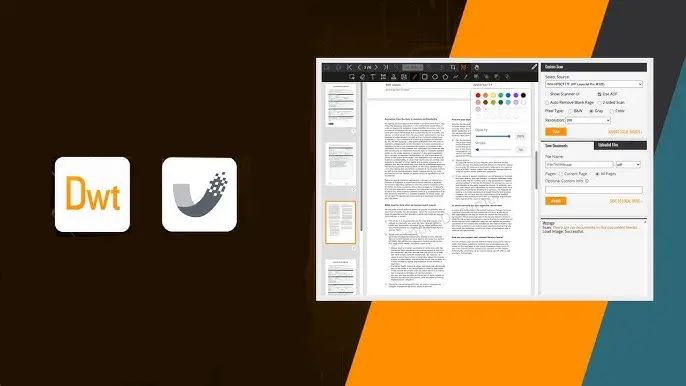
When it comes to viewing and editing PDFs, pairing Dynamic Web TWAIN(DWT) with the Dynamsoft Document Viewer (DDV) SDK can take your document workflow to the next level. This seamless integration allows you to handle PDFs efficiently, keeping them compact, readable, and easy to annotate, without extra load on storage...
Read more › -

With Dynamsoft’s Document Scanner extension for Chrome, you can easily scan documents directly into popular web applications such as Gmail, Outlook, or Salesforce. for Developers The extension is a part of the Dynamic Web TWAIN ecosystem, a browser-based document scanning SDK for developing web applications to scan documents in all...
Read more › -

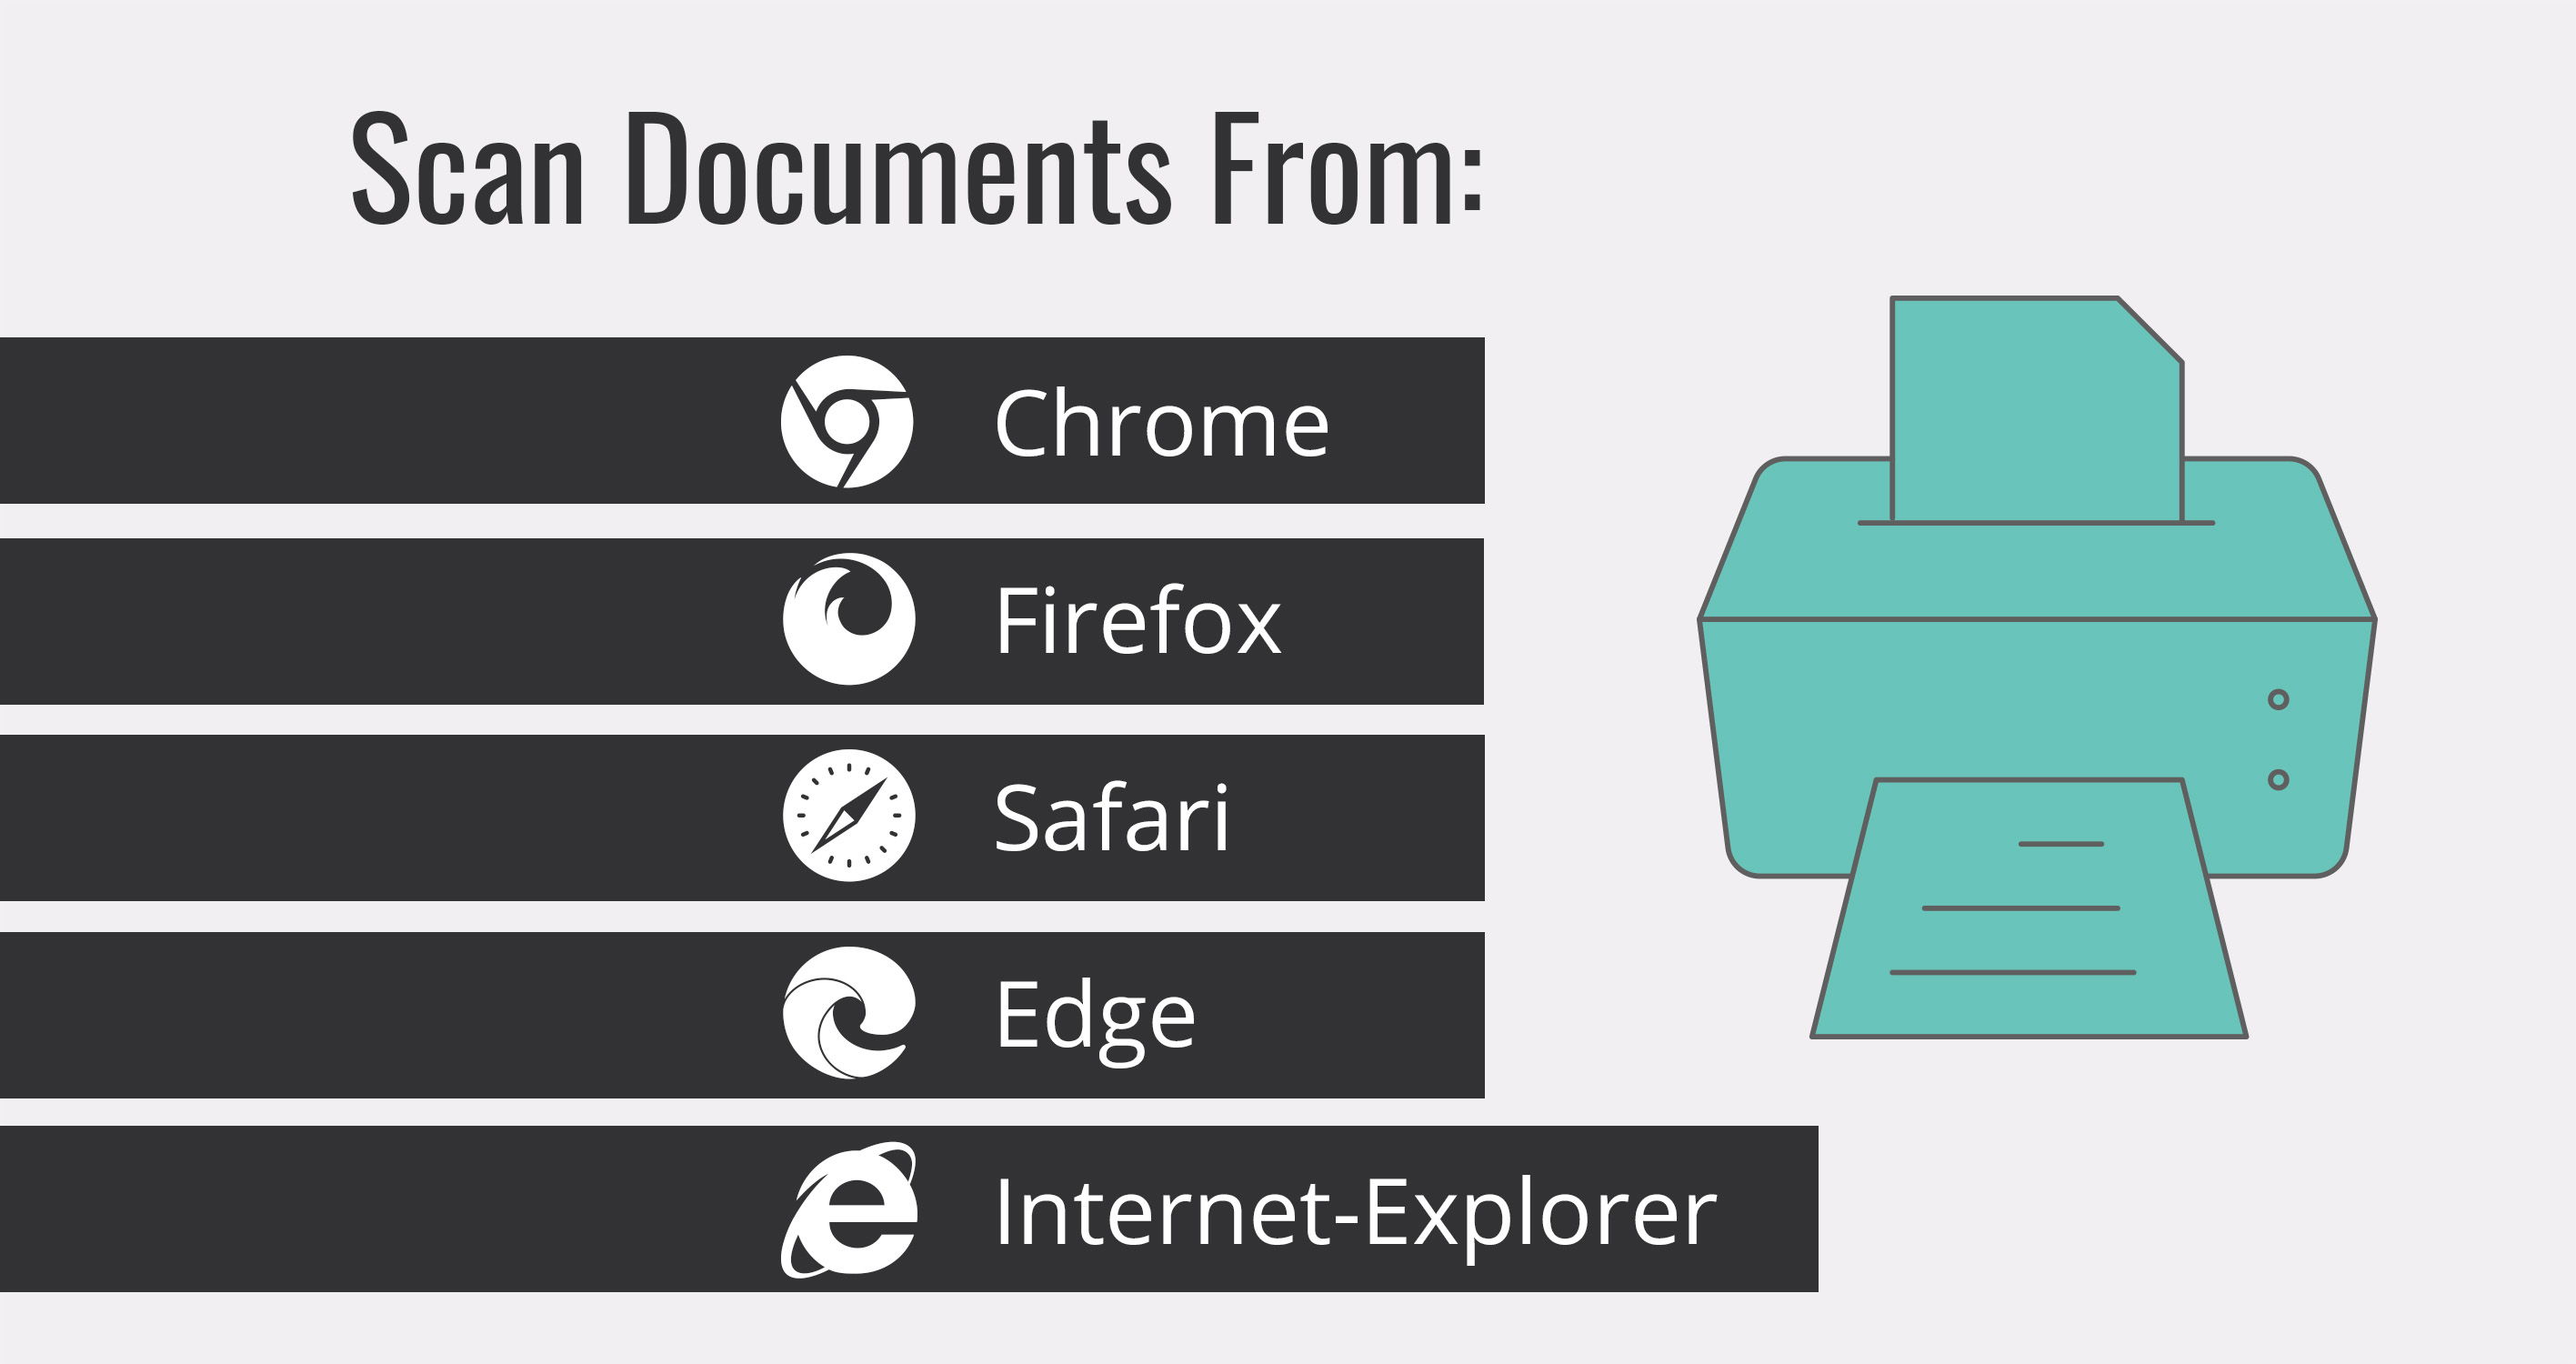
Dynamic Web TWAIN is recognized for its capability in online document scanning. Its structure includes two core components: Dynamsoft Service: This module processes commands from a JavaScript client, interfaces with TWAIN/SANE/WIA/eSCL/ICA protocols, and returns the scanned data to the JavaScript layer. JavaScript Client: This JavaScript library communicates with the Dynamsoft...
Read more › -

Como sabemos, el código JavaScript del lado del cliente en la web no puede interactuar directamente con un escáner de documentos. No existe una API de JavaScript disponible hasta que Dynamsoft la haga realidad. El SDK Dynamic Web TWAIN, que es un SDK de escaneo de documentos basado en navegador,...
Read more › -
Los sistemas de gestión de documentos basados en web que utilizan JavaScript/jQuery en el lado del cliente y PHP en el lado del servidor son ampliamente utilizados por las empresas. Estos sistemas permiten a los usuarios escanear documentos desde un navegador utilizando el escáner del lado del cliente, editarlos y...
Read more › -

أنظمة إدارة المستندات القائمة على الويب والتي تستخدم JavaScript / JQuery للجانب العميل و PHP للجانب الخادم تستخدم على نطاق واسع من قبل الشركات. تمكن هذه الأنظمة المستخدمين من مسح المستندات من المتصفح باستخدام الماسح الضوئي للجانب العميل وتحريرها وتحميل الصور على قاعدة بيانات على الخادم. ومع ذلك، قد يستخدم...
Read more › -

Dynamic Web TWAIN v18.2 Preview Scanning is an essential part of many businesses and organizations, and there are several protocols available to facilitate image acquisition. Two popular protocols for scanning are WIA (Windows Image Acquisition) and TWAIN (Technology Without An Interesting Name). With the recent release of Dynamic Web TWAIN...
Read more › -
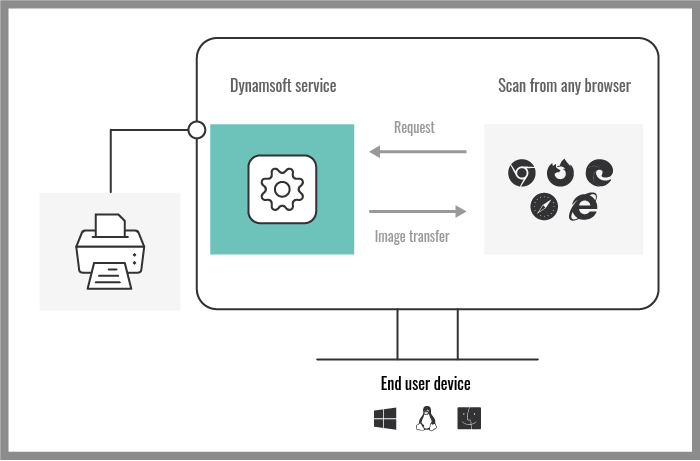
Enhancing Your Scanning Experience with Dynamic Web TWAIN’s Remote Scan Feature Are you tired of being chained to your office scanner? Dynamic Web TWAIN version 18 brings the exciting feature of Remote Scan, letting you break free. With Remote Scan, you can now share scanners across your office network and...
Read more › -

Remote Scan is a feature added in Dynamic Web TWAIN 16.2, which makes it possible to scan documents from physical document scanners to mobile devices. To enable a scanner to be accessible over the Intranet, we need to run Dynamsoft Service on the desktop that has the scanner physically attached....
Read more › -
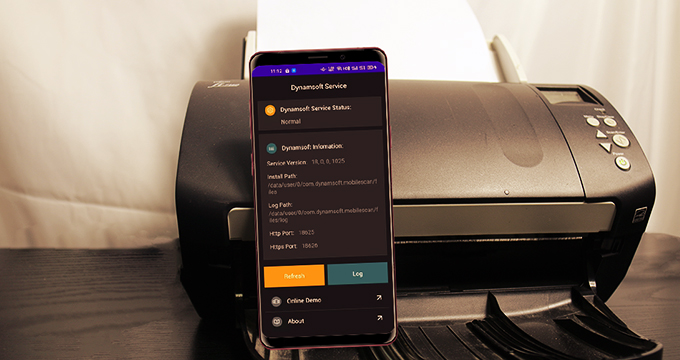
Dynamic Web TWAIN 18 has some exciting new features and one of them is the ability to scan documents from eSCL-compatible scanners or multi-function printers (MFP) directly to your Android mobile device. In this article, we are going to talk about how it works and how to use this feature....
Read more › -

Dynamic Web TWAIN v18 has some exciting new features and one of them is the ability to directly scan documents from eSCL-compatible scanners. Many modern scanners and multi-functional printers (MFPs) support the eSCL protocol. The protocol is a vendor-neutral network protocol that allows driverless scanning via ethernet, wireless and USB-connected...
Read more › -

As part of our web development initiatives, we recognize that web client-side JavaScript code cannot directly interact with a document scanner. Dynamic Web TWAIN SDK is a browser-based document scanning SDK that fully supports JavaScript programming for scanners and digital cameras. With this powerful SDK, effortlessly capture images and documents...
Read more › -

With 72.19% of Dynamic Web TWAIN customers having the requirement of supporting Chrome and Firefox in their application, support for document scanning in HTML5 browsers is paramount. Start your Free 30-day Trial Document Scan Online Demo After this installation users will be able to perform scanning operations within the browser....
Read more › -
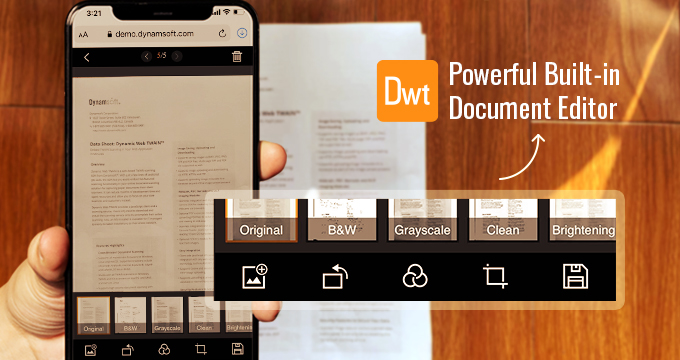
Mobile Web Capture is a cross-platform document scanning SDK for web applications. It supports all modern browsers such as Edge, Safari, Firefox, and Chrome on Windows, macOS, Linux, iOS, and Android. Its powerful built-in camera feature works in both desktop and mobile browsers, enabling users to scan and edit documents...
Read more › -

Dynamsoft was listed in the Top Software Development Companies in 2022 by Techreviewer- a research and analytics company focused on delivering lists of the top-performing companies in multiple industries. More than a hundred other large to mid-sized software companies made it to the list. Dynamsoft was recognised on the list...
Read more › -

Web-based document management systems that leverage JavaScript/JQuery on the client-side and PHP/ASP.NET/etc on the server-side are widely utilized by businesses of all sizes. These systems allow users to scan documents directly from a browser using a client-side scanner, edit them, and subsequently upload images to a server-side database. Given the...
Read more › -
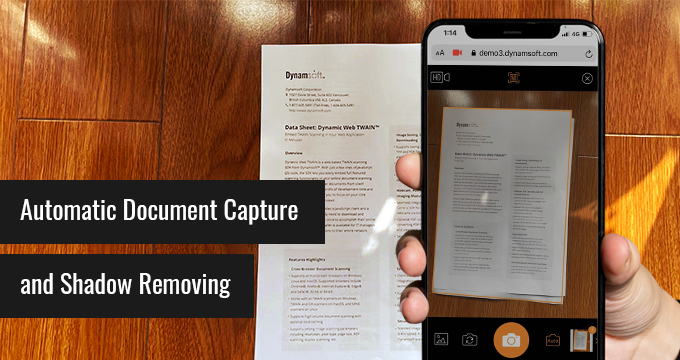
In Dynamic Web TWAIN 17.2, Dynamsoft brings a new API called scanDocument(), which launches a full-fledged HTML5 document scanning widget based on the WebAssembly technology. With a few lines of JavaScript code, you can develop a web-based document management app for both desktop and mobile web browsers. SDK Installation Steps...
Read more › -

Chrome has gained over 60% of market share worldwide. So, how to enable interaction with document scanners in Chrome? Dynamic Web TWAIN can work as a browser plugin that allows users to scan images and documents directly from a web browser. The plugin uses JavaScript APIs to access the computer’s...
Read more › -

Document Scanning Module in ASP.NET Web Forms Integrating document scanning capabilities into your ASP.NET web applications can significantly enhance their functionality. However, ASP.NET, being a server-side framework, does not have direct access to client-side devices such as scanners. To bridge this gap, you can leverage a browser-based SDK like Dynamic...
Read more › -

How to Interact with TWAIN Scanners in a PHP Application PHP is a popular server-side language, but it cannot directly interact with document scanners attached to client computers. However, with the continued growth of digitization, scanning capabilities have become increasingly important in PHP environments. To implement document scanning in your...
Read more › -

Enable Web TWAIN scanning in IE and Microsoft Edge browsers on Windows 10 Window 10 comes with two internet browsers - Internet Explorer (IE) 11 and Edge. Many customers inquire how Dynamic Web TWAIN works with the browsers on Windows 10. In short, Dynamic Web TWAIN fully supports browser-based document scanning...
Read more › -

The ability to easily store and retrieve digitized documents is an important feature of any document management system. In this article, we demonstrate how to use Dynamic Web TWAIN to expedite the development of a web document management application. You will see how to acquire documents from a document scanner,...
Read more › -

If you are developing a web application that requires the capability to deal with different digital file formats, chances are PDF will be a must-have file format. Scanning documents of text and graphics to PDF results in a compressed and visually clear file that can be read on a PC...
Read more › -

Compared to desktop applications, web-based applications integrated with a scanner SDK allow users to scan documents directly in the browser. This can include scanning from and scanning to remote locations. Web-based scanning SDK gives users better flexibility and convenience in document scanning. The Dynamic Web TWAIN SDK is a browser-based...
Read more › -
How to Scan Online from a Document Scanner On a desktop, open the online scanning page of Dynamic Web TWAIN in a browser. Access Your Scanners From a Browser You will be prompted to download the Dynamic Web TWAIN package. Install the package after downloading. Select your scanner from the...
Read more › -

Looking for a web-based document scanning toolkit for your users to do online document scanning and uploading easily to your website? Scan Documents from Scanners You may try this web application to access scanners from within a browser: Scan Your Documents Online Browser-based scanning SDK for software developers The web page above...
Read more › -

A webcam allows users to capture images and video streams in real-time. It is usually built into a laptop or physically connected to a computer via a USB port. Webcams can be used in many scenarios, including video conference calls, face recognition, security surveillance, etc. How to Access a Webcam...
Read more › -

Today more than ever one would think that U.S. businesses consume less and less paper each year. Despite the many opportunities that exist now to take a business digital in place of paper, paper consumption in the U.S. continues to increase. Regardless, there are many organizations turning to solutions for...
Read more › -

Google has announced that the good old user-agent string will be deprecated in the Chrome browser later this year. This change will provide better monitoring abilities, and let people know who is using this information and ultimately improve the end-users’ privacy. It is worth noting that this phase-out is currently...
Read more › -

Nowadays people expect their interaction with technology to be easy and uninterrupted regardless of location or device. An office is just one of the places people work today. Many professionals do their jobs from multiple locations. Citrix helps those people stay connected to the things people need to do their...
Read more › -

Dynamsoft has released a new version of the document scanning SDK, Dynamic Web TWAIN V16.0. This version extends the existing functionalities of its desktop version to the mobile platforms. Also, Dynamsoft has developed a brand new image viewer to deliver a unified document capture and management experience across Windows, Linux,...
Read more › -
In this tutorial, I’d like to share how to upload images, captured with Dynamic Web TWAIN (DWT), to Amazon S3. The adopted techniques include Dynamic Web TWAIN SDK, Amazon S3 REST API, JavaScript and PHP. You need to get familiar with DWT SDK and the Amazon S3 stuff (e.g., Bucket, Access Key,...
Read more › -
More and more organizations are in need of a document imaging solution to convert paper documentation into electronic / digitized documents. The primary purpose organizations look to do this is to more easily and efficiently access and manage their records and data. Such a migration from paper-based to digital-based document...
Read more › -
Last updated Mar 20, 2017, for an updated version, please visit Github Electron is a framework for building cross-platform desktop Apps with HTML, JavaScript, and CSS. Dynamic Web TWAIN is also a cross-platform JavaScript library for document scanning, it’s pretty easy to implement a document scan app with Electron and...
Read more ›


