Category: barcode-practices
-
7 Factors to Consider Before Choosing a Barcode Reader SDK Barcode reader software development kits (SDKs) are essential tools for businesses that need to decode barcodes. However, choosing between open source and proprietary barcode reader SDKs can be a challenging decision. While open source libraries are free, they are inherently...
Read more › -

La numérisation de plusieurs codes-barres est efficace en termes de temps dans divers scénarios, tels que les étiquettes d’expédition, les étiquettes de prix des supermarchés, les inventaires, etc. Cela accélère considérablement le processus de numérisation des codes-barres et rationalise le flux de travail. Selon les différents cas d’utilisation, le nombre...
Read more › -

Dynamsoft Barcode Reader (DBR) is an enterprise-grade barcode scanner SDK (Software Development Kits). It can transform desktops and mobile devices into powerful barcode scanners so that dedicated devices are no longer necessary. Many companies have already benefited from the powerful barcode recognition of DBR and by using it they can...
Read more › -

Accurately capturing data from paper forms can be extremely challenging. Re-keyed-paper-based-form data not only is human-intensive, it’s also error-prone. Optical Character Recognition (OCR) can help reduce the amount of human involvement. However, it still requires some human supervision to ensure the data capture process is done correctly. Streamline workflow using...
Read more › -

Multiple barcode scanning is time-efficient in various scenarios, such as shipping labels, supermarket price tags, inventory counting, etc. It greatly speeds up the barcode scanning process and streamlines the workflow. Depending on different use cases, the count of barcodes in one image can vary from a few to dozens. And...
Read more › -
While barcodes are widely used for their speed and efficiency, there are many potential technical obstacles and issues that can arise to create bottlenecks and inefficiencies. This series will guide you through the following topics on barcode reader technology: Chapter 01 Where are barcodes used Chapter 02 Character set encoded...
Read more › -
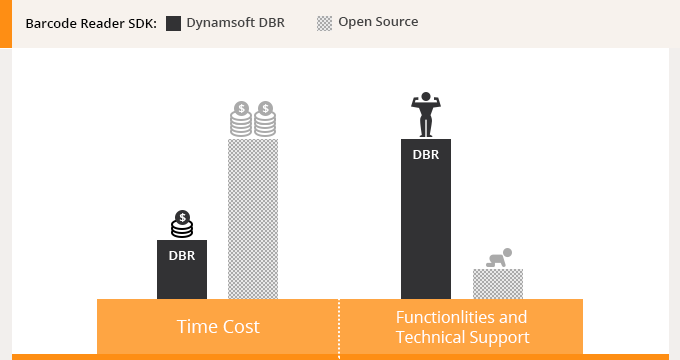
There are a lot of different barcode reader solutions on the market, including some free open source options, which begs the question – Why choose Dynamsoft Barcode Reader? While ‘free’ sounds good, there are some factors you may want to consider. Hidden Cost First, let’s address the obvious – cost....
Read more › -
Whether you are working with an inventory system, a medication administration system, or another system that uses barcodes, chances are you may on occasion encounter unreadable barcodes. Software developers certainly have levels of control over the accuracy of barcode recognition in an application. But, for end users of a barcode...
Read more › -
Getting started with Barcodes A good place to start is with understanding what barcode symbology is most ideal for your application. This might include considering any industry and related regulation needs and requirements. Make sure to follow common practices. Be clear about the character set you need to support your...
Read more › -

Developer Tip: Improve Barcode Recognition Rates In the fast-paced world of software development, improving the accuracy and speed of barcode recognition is a crucial challenge for developers. This blog explores 4 essential tips and techniques that can help enhance barcode scanning capabilities. Learn about resolutions, dealing with damaged barcodes, and...
Read more › -

Understanding the barcode reader technology can be complex. So, let’s simplify it. The barcode reader software scans the entire width of a barcode image to identify a barcode. Once it scans a barcode, it decodes it and presents the encoded information. Step 1: Identify a Region Where the Barcode is...
Read more › -

There is a lot to consider when attempting to select an appropriate barcode to use. You should familiarize yourself with the various barcode types, their capabilities, and requirements, to ensure a proper barcode selection for your given scenario. To select the barcode for your given task, you need to understand...
Read more ›


