Release Notes
-
SourceAnywhere 6.5
12/28/2018- Improved the Export feature in the file history explorer to support exporting differences of all history versions to .csv or .txt.
- New check-in actions performed on a shared file from other shared locations is now recorded with full paths of the shared locations in the file history explorer.
- SmtpClient.dll (part of the SourceAnywhere Server program) is updated to support .NET Framework v4.
- Fixed the bug where the SourceAnywhere service might stop working at Branch action if the Email Notification feature was turned on in Server Manager.
- Fixed the bug where a local file opened in Visual Studio didn't get auto reloaded with the latest update from the server if the server version had the same file size as the local one.
- Other minor fixes and improvements.
-
SourceAnywhere 6.4
12/19/2017- Improved the Find in Files feature to support searching special characters.
-
Added Purge and WildcardSearch commands to the Command Line Client.
Purge Purge deleted items from the repository. The purged items cannot be recovered.
Required Params: -server, -port, -username, -pwd, -repository, -prj;
Optional Params: -file -comment, -ptype, -pserver, -pport, -puser, -ppwd.
WildcardSearch Searches files which match the input string.
Required Params: -server, -port, -username, -pwd, -repository, -wildcard -prj;
Optional Params: -r -ptype, -pserver, -pport, -puser, -ppwd.
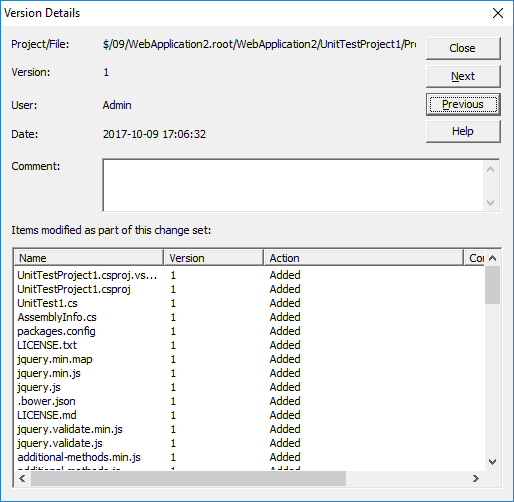
- Added Next and Previous buttons to the Version Details dialog.
- Other minor fixes and improvements.
-
SourceAnywhere 6.3
12/06/2016- Added 'Repository Administrator' group. A repository administrator is allowed to manage a specific repository via Server Manager.
- Greatly improved the performance when branching a large project via Windows GUI Client.
- Working folder path and cloaked project info are now saved to the SQL Server database.
- Added support for Transport Layer Security (TLS) 1.2 protocol
- Added a "Branch after share" option to directly branch a shared file when you drag and drop to share a file.
- Added an option to filter shared files in the Status Search dialog box.
- Improved the display of shared file history in the Show History dialog box by filtering duplicated info.
- Other minor fixes and improvements.
-
SourceAnywhere 6.2
12/01/2015- Added new methods BranchFileEx and BranchProject in the Command Line Client.
- Improved the method GetProject that a project could be downloaded by version or by label.
- Improved Share command that the default target path is the item's parent folder.
- Improved contents type to display all information or error only.

- Other minor fixes and improvements.
-
SourceAnywhere 6.1
09/15/2014-
Improved folder level Branch & Merge.
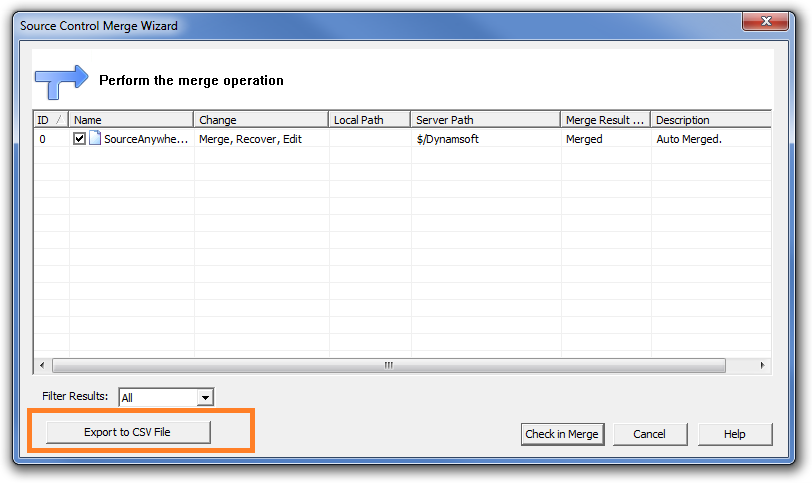
- Type of Merge, Recover, Edit is now supported.
- Merge result can be exported.
- Improved merge by label.
- Improved Project & File Branches Property interface.
- Added auto detection of server names and instance names of SQL Servers when installing the server.
- Other minor fixes and tweaks.
-
Improved folder level Branch & Merge.
-
SourceAnywhere 6.0
07/29/2014-
Added folder-level Branch & Merge.
- Branch: Folder and file items can be branched directly to another location without being shared first.
- Merge: Branched folder and file items can be combined into one location.
- Other minor fixes and tweaks.
-
Added folder-level Branch & Merge.
-
SourceAnywhere 5.1
03/18/2014- Added two new folder-level permissions, "Web Deploy" and "List Folder Content".
- Enhanced Keyword Expansion support for TSQL.
- Improved performance of the SourceAnywhere Server during concurrent operation execution.
- Enhanced usability and user-friendliness during installation, and during regular program use.
- Other minor fixes and improvements.
-
SourceAnywhere 5.0
01/21/2014-
A built-in database has been added as an option during the installation of the SourceAnywhere Server.
Now you can choose either the built-in database or your own Microsoft SQL Server as the database backend.
- Further improved security and stability of SourceAnywhere.
- Other minor fixes and tweaks.
-
A built-in database has been added as an option during the installation of the SourceAnywhere Server.
-
SourceAnywhere 4.4.1
09/24/2013- Added 64-bit SourceAnywhere Server. With the 64-bit server, the capacity and performance on server-side is greatly improved.
- Fixed a bug in branch and share operations.
-
SourceAnywhere 4.4
07/09/2013- Improved the performance of file transfer for the "Get" and "Check out" operations, especially for local teams.
-
Added features
-
Optional warnings available at Tools->Options. You can choose to display a warning message when
- Check out an already checked out file
- Exit SourceAnywhere Client when there are checked out items
- Delete/purge a file or project
-
More options in the "Add Files" dialog
- You can "Check out Immediately" the added files
- You can "Remove local copy" of the added files
-
Optional warnings available at Tools->Options. You can choose to display a warning message when
- Now you can do Diff when you check in a file or project
- Other minor fixes and tweaks.
-
SourceAnywhere 4.3
02/01/2013- Added Share Command in the right-click menu.
- Fixed bug where 'Delete' keyboard command doesn't work in Source Location bar.
- Fixed bug where using keyboard command to select file doesn't work when file list is not sorted by name.
- Other minor fixes and tweaks.
-
SourceAnywhere 4.2
11/26/2012- Fully support Visual Studio 2012.
-
Added features & improvements in Command Line Client -
- Added User parameter (for Status command) to return a list of files checked out by a specified user.
- Added Diff command to detect if a local copy is identical with the latest server version.
- Added Link command to return all share links of a specific file.
- Improved GetFilesHistory command and GetProjectHistory command. Both now support displaying comment column.
- Improved GetFileList command to display folder list in the result window.
- Other minor fixes and tweaks.
-
SourceAnywhere 4.1
10/17/2012- Added support for sharing files and folders via drag & drop.
- Added support to display complete check-out user list in SourceAnywhere Explorer when a file is checked out by multiple users.
-
Added auto refresh option.
With it enabled, SourceAnywhere will automatically refresh the file list to keep information displayed in SourceAnywhere Explorer up to date.
-
Improved user experience on File Properties Dialog:
- Added scroll bar in Links tab
- Links are now sorted correctly in Links tab
- Remember the last selected tab
-
Improved Command Line Client:
- Added MultipleCheckouts parameter to CheckOutFile and CheckOutProject commands
- Added Status command to return a list of all checked out files
- Added support to delete files in the result window of Wildcard/Status Search and File in Files.
- Other minor fixes and tweaks.
-
SourceAnywhere 4.0
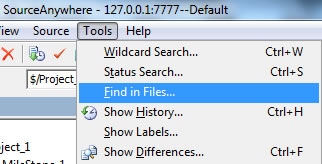
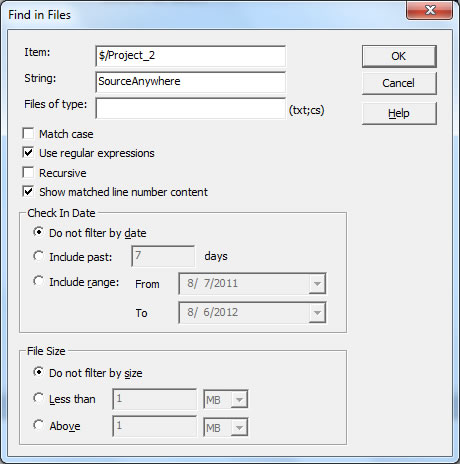
08/07/2012- Added the Find in Files function to facilitate searching among projects for files containing specified string. It can be achieved in Tools | Find in Files.
- Change the default value of the Local Path in Show History | Diff | Target Path |Browse to based on local working folder.
 The same is applied for Show Differences as well.
 - Added support to search for label in Show Label dialog box.

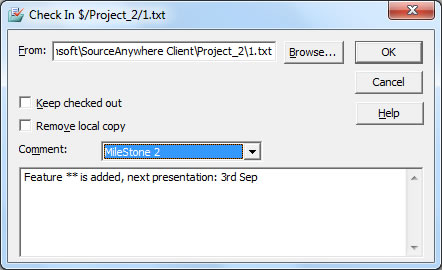
- Comments can be saved as templates on the Server side and users can select a comment template when checking in files. Add a comment template from the server side:
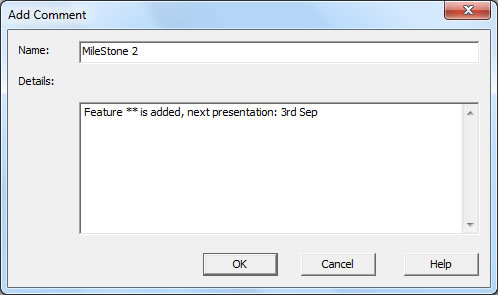 Select a comment from the client side:
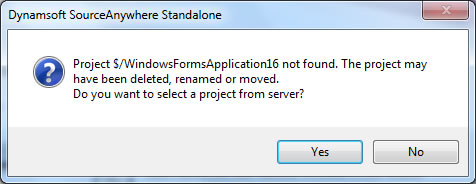
- In Visual Studio, when switching projects that reside in different repositories, user will be asked to reselect from repository.
- Other minor bug fixes and tweaks.
- Added the Find in Files function to facilitate searching among projects for files containing specified string. It can be achieved in Tools | Find in Files.
-
SourceAnywhere Standalone 3.0.1
04/07/2011- Fixed the following bugs in VSS Import Tool:
-
- Incomplete log file.
- File Content dialog may be not closed after the import completes in some situations.
- Concurrent file access issue.
- Fixed bug where sorting by filename in Pending Checkins window doesn't work properly.
- Fixed bug where keyword expansion may cause EOL issue in rare situations.
- Fixed bug if you perform Get Latest Version on checked-out files to other folders, the files become writable.
- Other minor fixes and tweaks.
-
SourceAnywhere Standalone 3.0
01/11/2011-
New core functions:
-
Support for Multiple SQL Server Databases as Storage.
Advantages: 1. Facilitate individual repository backup. 2. Break through database storage limitation of free SQL Server Express.
-
Email Notification System.
Assigned receivers will receive notification emails when specific events, such as check-out/check-in/Label, are triggered.
-
Pending Checkins window.
It displays all files checked out by the current user. Tracking check-out path (including computer name) is also supported..gif)
- Shelve/Unshelve pending changes.


-
Display File Status in the Windows Client Explorer.
File status is shown as a column in the explorer pane. Five file statuses are supported:
Normal, Missing, Old, Modified, and Unknown.
- Set proxy server on Cache Server side.

-
Support for Multiple SQL Server Databases as Storage.
-
Core performance improvements:
- Dramatically improved overall performance by introducing ZIP compression technique on network layer.
- Greatly speeded up Show Project History operation, especially for projects with lots of history records.
- Optimized Refresh behavior on project tree.
- Optimized integration with Visual Studio. Add-in technology is applied to reduce unnecessary refresh event.
- Cache file optimization. SourceAnywhere Standalone now supports writing cache into memory. The performance improvement is obvious when the cache size is larger than 3 MB.
- Optimized Project Security page in Server Manager. It's now much faster to check the user rights.
-
User experience improvements:
-
Added prompt messages in the following situations to double ensure the operation:
- Performing Check In/ Undo Check Out operations on shared files which were checked out to another location.

- Performing Check Out/ Undo Check Out operation on files which were checked out by others.

- Performing Check In/ Undo Check Out operations on a file which was checked out on another PC.

- Performing Check In/ Undo Check Out operations on shared files which were checked out to another location.
-
Security:
- Users can now only see repositories to which they have access right on connecting to SourceAnywhere Standalone Server.
- Project structure is hidden from users without read right to its parent folder.
-
Convenience:
-
Automatically perform Web Deploy operation on web files on check-in.

- Adjustable window display modes: Floating, Dockable, Auto Hide and Hide.

- Remember the Client status when exiting.
- Display working folder path as hyperlink.

- Batch operations supported in Status/Wildcard Search Result Dialog Box.
- "Mergeable file type" configuration is cancelled. Show Difference operation is always supported for non-binary files.
- Show History operation supported in Project Difference Dialog Box.
- Added Source Location bar which enable users to locate to a specific project directly.

- Added "Error Report" field in the Monitor window of VSS Import Tool to help users pinpoint the failed imported files.

- Added modeless window viewing mode.
- Added optional merge modes.

-
Automatically perform Web Deploy operation on web files on check-in.
-
Other minor improvements:
- Keep internal share links of a project when performing Branch on it.
- Optimized the comment type of Keyword Expansion feature.
- Optimized the messages returned by Web Deploy operation.
- Improved Add Files dialog box.
- Added more file extensions as default non-binary file.
-
Added prompt messages in the following situations to double ensure the operation:
-
Bug fixes
- Fixed bug where other users fail to get the updated file without reopening it when the size of a file remain the same after being edited in Visual Studio IDE Client.
- Fixed bug where the label is inherited incorrectly when adding a label on a labeled project version.
- Fixed bug where users cannot add new items to an existing label in Label Promotion Dialog Box.
- Fixed bug where the status of web-deployable folders may get lost when re-opening the Client.
- Fixed abnormal display bug in Project Diff Result Dialog Box.
- Fixed bug where "The parent project not found in the label tree" error may occur during importing VSS database.
- Fix bug where the comment format generated by Keyword Expansion feature might lead to compilation error in Visual Studio.
- Fixed bug where VSS Import Tool fails to import the deleted files in VSS database.
- Other minor fixes and tweaks.
-
New core functions:
-
SourceAnywhere Standalone 3.0 Beta
12/14/2010 -
SourceAnywhere Standalone 2.3.1
07/13/2010-
Enhanced MSSCCI Plug-in
- Added support for moving files and folders.
- Increased performance of MSSCCI plug-in by 30%~50% when working with large projects.
- Improved integration with SQL Server Management Studio and uniPaaS.
- Improved support for Web Projects in Visual Studio.
-
Significant improvements of VSS Import Tool:
- Enabled the users work normally while import is still in process. Users are able to access/edit the data once the latest versions of files/projects are imported.
- Divided VSS database importing process into four stages: import items, import file content, import pin status and import labels.
- Greatly improved performance by introducing multi-threading technology.
- Improved performance of refreshing projects.
- Optimized Label import.
- Improved stability.
- Other minor bug fixes and tweaks.
-
Enhanced MSSCCI Plug-in
-
SourceAnywhere Standalone 2.3
3/30/2009- Added Ant Plug-in which allows users to integrate SourceAnywhere Standalone with Ant which supports automatic building.
- Added support for Windows Integrated Authentication.
- Added project diff functionality to SourceAnywhere Standalone Java Client.
-
Show Difference operation improved:
- Users can use Show Differences command to compare a file/project to any of their own versions or to others in a local or server path.
- Added View Options in the Show Differences dialog box when comparing projects.
- Added Ignore Tab and Ignore White Space options to the Difference option.
- Added Wildcard Search functionality to SourceAnywhere Standalone Windows Client, which allows users to use wildcard characters while searching for files.
- Users can now deploy files in a web project.
- Added a dialog box which appears when users try to delete an item which is already deleted from the project.
- Users can now alter comments through Version Details.
- Added Remote Size column in the Search Result dialog box.
- Added tooltip in the dialog box which prompts when checking out or getting a file when a writable and modified copy already exists in the working folder.
- Fixed bug where registry info of SourceAnywhere Standalone persists after uninstalling SourceAnywhere Standalone.
- Other minor bug fixes and tweaks.
-
SourceAnywhere Standalone 2.2
1/25/2008-
Project Diff operation greatly improved in Windows GUI Client.
- The performance is greatly improved and the interface is more friendly.
- Allows users to perform operations, such as Add Files, Delete, Get, Check Out/In, Undo Check Out, Show Difference, Reconcile All, in the Project Difference dialog box.
- Added Advanced options for choosing files to show in the Project Differences dialog box.
- Added Annotate functionality, which enables users to easily determine who and when made the last changes on each individual section of file.
-
MergeHero interface greatly improved. More like Microsoft Visual SourceSafe Visual Merge. More friendly to use.
- Added Changed Text marker to designate conflicting changes to a file.
- Added optional way to apply/remove changes - by left clicking the button-like lines in the top two panes.
- For File Diff, added display options for Ignore Tabstop and Ignore White Space.
- For Directory Diff, added display options for showing only the files exist in the left/right side, or only the identical/different ones in both places. (Show Left-Only Files, Show Right-Only Files, Show Identical Files, Show Different Files).
- Added support for Dreamweaver CS3.
- Added "Remember Password" option in Login dialog box of GUI Client, Visual Studio IDE Client and Eclipse Plug-in.
- Improved COM SDK.
- Fixed bug where Working Folder positioning failed in the Add Files dialog box when some special software is included in the Folders pane.
- Other minor bug fixes and tweaks.
-
Project Diff operation greatly improved in Windows GUI Client.
-
SourceAnywhere Standalone 2.1
10/28/2007- The database of SourceAnywhere Standalone 2.1 is compatible with the database of SourceAnywhere Hosted.
- Added Encrypt/Decrypt page in Server Manager which allows users to encrypt or decrypt databases to ensure the data security.
- Web Deploy functionality optimized. A web project can be deployed to a FTP server, or multiple FTP servers. And the performance is improved by deploying only changes made in projects.
- SourceAnywhere Standalone is improved to support Eclipse 3.3.
- Java Client can be launched directly by double-clicking the application.
- Added export functionality which allows users to export file/project history, search result and file list.
- SSL root certificate is exported and imported automatically when using SSL encryption.
- Added Description and Email columns in Users page of Server Manager.
- Allows users to see users count in Server Manager.
- Added a file state in IDE Client which helps users judge whether the local copy is the latest version.
- Fixed bug where Server IP in Service Relation page of Cache Server Manager cannot be domain name.
- Other minor bug fixes and tweaks.
-
SourceAnywhere Standalone 2.0
2/09/2007Product name changed from "SourceHero" to "Dynamsoft SourceAnywhere Standalone".
The improvements in version 2.0 include the following:
- Cross Platform (Java GUI Client Added)
- Cache Server Added
- Command Line Client Added
- Eclipse Plug-in Added
- Macromedia Studio Plug-in Added
- SDK Added
- Server-side Improvements
- Windows GUI Client Improvements
- Dynamsoft SourceAnywhere Standalone Help
-
Cross Platform (Java GUI Client Added)
With a Java client in addition to the standard Windows client, Dynamsoft SourceAnywhere Standalone 2.0 can run on any platform that SWT (Standard Widget Toolkit) supports, such as Linux, MAC and Solaris, etc.
-
Cache Server Added
From version 2.0, Dynamsoft SourceAnywhere Standalone provides a caching solution (optional) for distributed development. It is used to cache copies of requested server files, thereby improving the client responsiveness.
-
Command Line Client Added
In addition to the GUI Client, Dynamsoft SourceAnywhere Standalone provides a Windows and a Java Command Line Client for users who prefer typing commands and those who write or maintain batch files for automatic source control processing. Dynamsoft SourceAnywhere Standalone Command Line supports all the major operations required for source control.
-
Eclipse Plug-in Added
Dynamsoft SourceAnywhere Standalone Eclipse plug-in is a team provider plug-in for the Eclipse IDE. It enables users to perform Dynamsoft SourceAnywhere Standalone operations within the Eclipse IDE.
-
Macromedia Studio Plug-in Added
Dynamsoft SourceAnywhere Standalone Macromedia Studio plug-in enables Dreamweaver or Flash users to access their Dynamsoft SourceAnywhere Standalone repositories remotely and perform basic operations.
-
SDK Added
Dynamsoft SourceAnywhere Standalone provides a Software Development Kit (SDK) which enables software developers to integrate Dynamsoft SourceAnywhere Standalone functionality with their applications. Through Dynamsoft SourceAnywhere Standalone Software Development Kit's APIs, you can develop applications that provide the similar functionality as the client software of Dynamsoft SourceAnywhere Standalone.
-
Server-side Improvements
- Management of Dynamsoft SourceAnywhere Standalone Server is divided into two parts: general configuration of Dynamsoft SourceAnywhere Standalone service is accomplished through the Service Configurator utility, and repository-related management is done through Server Manager.
- Added support for SSL encryption.
- Added server caching capability. Requested data can be cached on server to speed up client access.
- Added connection pool. Provides an efficient way of maintaining database connection.
-
Windows GUI Client Improvements
- Improved performance when refreshing file list.
- Added support for SSL encryption.
- Added socket validity check functionality. Enables Dynamsoft SourceAnywhere Standalone to check if the socket is valid before network operation.
- Added exclusive locks functionality. Allows you to set the default option for the Request Exclusive Lock checkbox in Check Out dialog box.
- Added Duration for file status caching option for the General tab of Visual Studio IDE Client options. Checking this option may improve the performance of IDE client when there are a large number of files in the solution.
- Fixed other minor bugs.
-
Dynamsoft SourceAnywhere Standalone Help
Documentation revised.
-
SourceHero 1.0.1
6/14/2006Fixed bug where SourceHero server installation fails when your default system date/time format is as follows:
- Short date formats with date ahead of month, such as dd-MMM-yy
- Time formats with minute or second ahead of hour, such as mm:h:ss
- Date or time formats with special separators, such as "?"
For those who have installed SourceHero 1.0 successfully, there is no need to upgrade.
-
SourceHero 1.0
5/15/2006SourceHero 1.0 released!
-
SourceHero 1.0 (Beta)
1/05/2006SourceHero 1.0 (Beta) released!


