SourceAnywhere Hosted incorporates a range of security features that secure your source code from accidents and malevolent attacks. Here's how the features break down.
-
Secure Sockets Layer (SSL) Protocol
Secure Sockets Layer (SSL) is a strong cryptography and security protocol used to safeguard sensitive data during transmission over open, public networks. Originally developed by Netscape to secure online financial transactions, SSL is now one of the leading security protocols on the web. Today, SSL supports millions of online transactions every day and is the de facto standard for secure online credit card purchases, stock trading and banking.
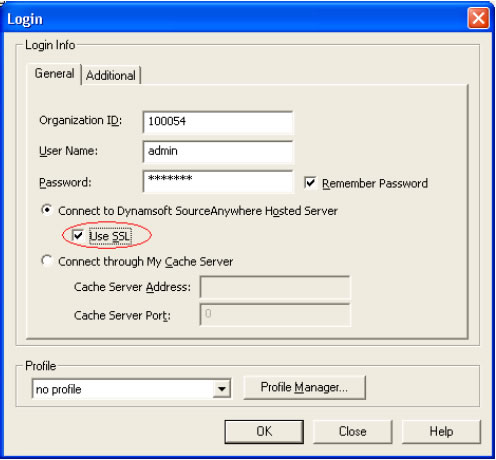
SourceAnywhere Hosted provides 128-bit SSL encryption to protect your data, including passwords and data files, being transferred across the Internet.
-
Sophisticated Password Policy
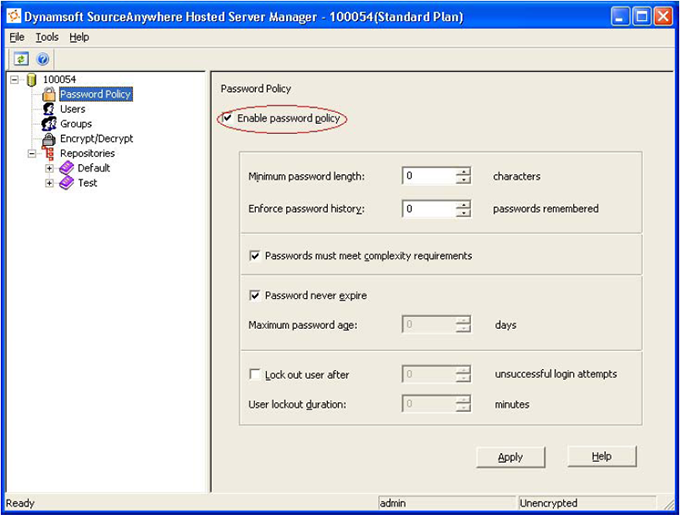
Passwords are the front line of computer security. SourceAnywhere Hosted uses an industry-standard approach to password policy. We enable granular control of password length, memory, complexity and expiration.
The 'Minimum password length' and 'Password must meet complexity requirements' settings can make a password very difficult to hack.
The 'Enforce password history' feature prevents old passwords from being reused again and again.
The Maximum password age feature can force the user to change his/her password after a certain period and if an attacker cracks the password, he/she only has access to the network until the password expires. Also, since the password must be changed periodically, it is difficult for attackers to crack.
The 'Lock out' option prevents hackers from guessing at passwords. This feature is particularly important for network applications, like SourceAnywhere Hosted. Here's the example. If a server responds to a login request in 100 milliseconds, an attacker can try 36,000 different passwords in 1 hour. By using the 'Lock out' setting, administrators can minimize the number of password attempts within a specified time frame. For example, if an administrator mandates a 10-minute lock out after five incorrect attempts, the attacker can only try 30 passwords within one hour. This obviously makes a password much safer.
-
Independent and Isolated Databases for Each Customer
In the SourceAnywhere Hosted server each customer's data is stored in an independent, dedicated database that's isolated from other customers' data. Customer can only access their specified database, and operations on any other database will have no influence on other customers' data.
-
Database Encryption, the Ultimate Way
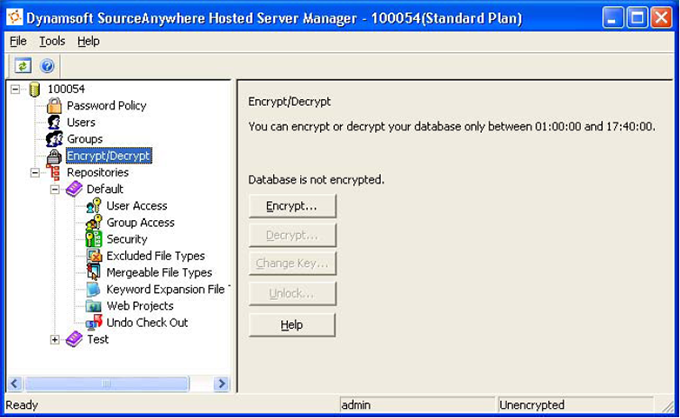
SourceAnywhere Hosted provides database encryption, which is an ultimate approach to protect your data. With database encryption, all of your file content stored in SQL Server is encrypted by a passphrase you provide during the encryption process. Under the unlikely worst scenario, even if your database is copied without your permission, no one can read a single file in your repository unless they know your passphrase.
This is how it works: when a SourceAnywhere Hosted server is restarted, an unlock process is required before the server dynamically decrypts your data. Your passphrase is then verified for the unlock. Once the unlock process is complete, your developers can check in and check out files as usual.
Even after the unlock process, the data in your database is still encrypted. This is because SourceAnywhere Hosted servers dynamically decrypt file content into memory only when the file is requested. Combined with cache file encryption, SourceAnywhere Hosted's database encryption guarantees that none of your files is written to hard disk without being encrypted first.
There are two options for database encryption:
- Your passphrase is encrypted by a public key using a certificate issued by VeriSign and stored in a secured place. If you forget your passphrase, Dynamsoft will use the private key of the certificate to recover your passphrase. The private key is protected by a rigorous security policy and is known to only two persons at Dynamsoft: the Chief Systems Administrator and the CEO.
- Your passphrase is not stored. This gives you extra security, but you run the risk of rendering your entire database useless if the passphrase is lost or forgotten.
-
Cache File Encryption for Speed and Security
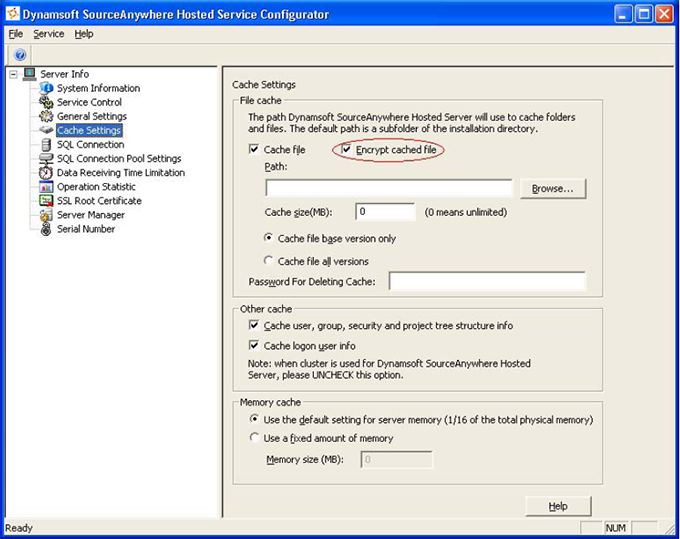
SourceAnywhere Hosted uses a sophisticated cache mechanism and Cache server to reduce server workload and improve performance. For the cached files, SourceAnywhere Hosted uses Blowfish encryption to ensure the security of data during the process of caching.
The passphrase is randomly generated by the server when it is started and discarded when the server is down.
Combined with database encryption, cache file encryption guarantees that no file content is written to hard disk without being encrypted.
-
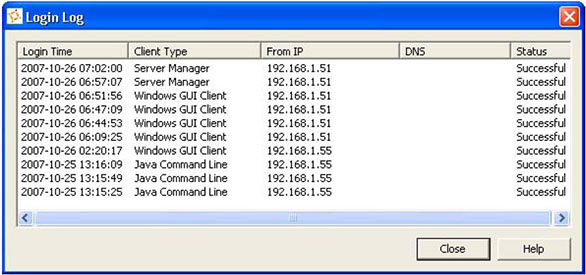
Login Log for Monitoring Suspicious Activity
You can use SourceAnywhere Hosted's Login Log to view the 10 latest login attempts to Hosted Server using your organization ID and user name. Using this feature, you can easily identify any suspicious activity in your account. For example, you did not use SourceAnywhere Hosted yesterday, but you see a login log for yesterday or you use SourceAnywhere only from the office but you see an unfamiliar IP in the login log. Once the suspicious activities are identified, proper measurements can be taken to stop the damage.
-
Flexible IP & MAC Filter Rules
You can set up IP & MAC filter rules in SourceAnywhere Hosted. You can create rules for a collection of IP and MAC addresses that allow only specified addresses to access your SourceAnywhere Hosted account. If you choose not to define rules, then all traffic is allowed.
The optional IP filter adds another layer of security. For example, if you only access SourceAnywhere Hosted from your office, you add your office IP address in the filter so your SourceAnywhere Hosted account cannot be accessed from outside of your office. If you also access SourceAnywhere Hosted from home, you can add the IP address of your home in the filter. In the case that your IP address is dynamic (using dial-up), you can simply input your network interface card's MAC address into the filter. Also you can use MAC addresses exclusively to make sure only the specified physical machine can access your SourceAnywhere Hosted account.
Note: IP Filter does not apply to SourceAnywhere Hosted web site.

-
SSL Certificate for Web Site Access
All your account information on our website is encrypted by SSL Certificate.
-
Secure Backup Encryption
All SourceAnywhere Hosted backups are password encrypted. Plus, the backup folder is also encrypted using Microsoft Windows 2003 Public Key Infrastructure (PKI) file system.


