


Thanks for Downloading Dynamic Web TWAIN 30-Day Trial!
Your download will start shortly. If your download does not begin, click here to retry.
Error Troubleshooting
How to debug on Dynamic Web TWAIN online demo?
With the widespread application of the Dynamic Web TWAIN SDK in the market, more and more developers need an effective way to debug. Dynamsoft provides an official demo that enables developers to verify online whether their scanners and code can function properly. This article introduces how to utilize the browser developer tools to test the code through the Dynamic Web TWAIN online demo.
Step 1:
Visit Dynamic Web TWAIN Online Demo: https://demo.dynamsoft.com/web-twain/ Open your web browser console (f12 or right clicking and inspecting) and navigate to the console tab. From here we can make calls directly into the browser.
Step 2:
Given that the demo is presented via the iframe element, to acquire the WebTwain instance, you need to make the following configurations.
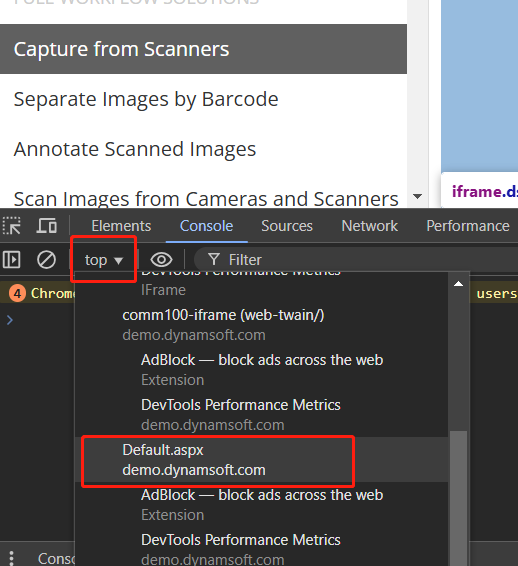
As an alternative, you can straightforwardly call the top[0].DWTObject.
Step 3:
You’ve now obtained the WebTwain instance.
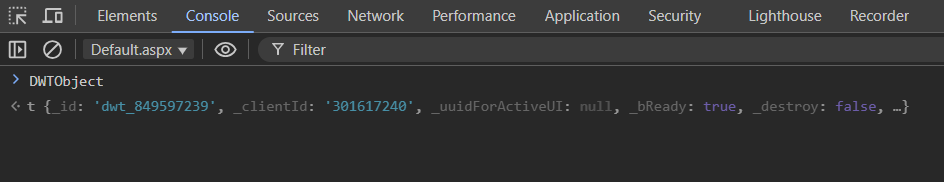
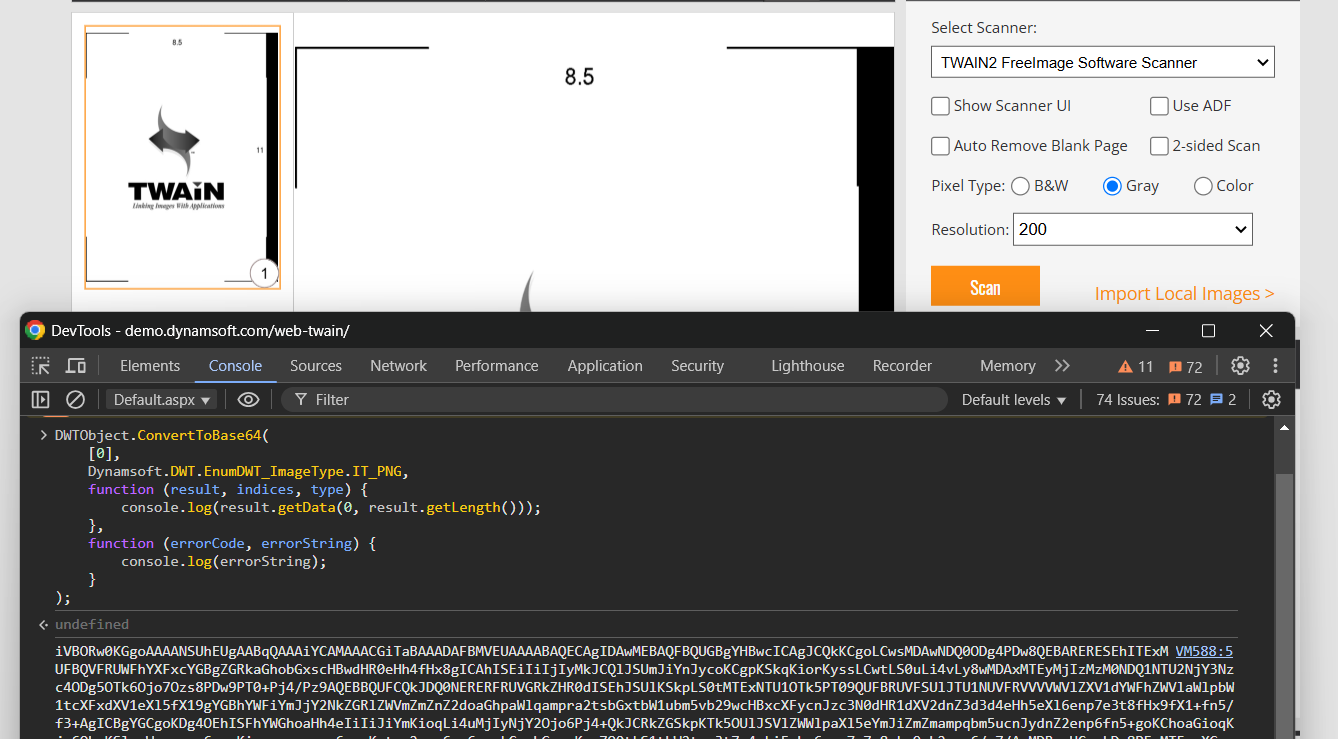
And you can test the API as much as you want. Let’s take the ConvertToBase64 as an example. After you input the code into the console and press Enter to run this code snippet, it will convert the image at index 0 in the buffer (that is, the first image) into a Base64 string.
Now that you’ve had the opportunity to preview how the DWT API operates in the web application, you can explore more features by reviewing the API documentation.